Efficient processing of big data, especially with Spark, is really all about how much memory one can afford, or how efficient use one can make of the limited amount of available memory. Efficient memory utilization, however, is not what one can take for granted with default configuration shipped with Spark and Yarn. Rather, it takes very careful provisioning and tuning to get as much as possible from the bare metal. In this post I’ll demonstrate a case when not-so-careful configuration of Spark on Yarn leads to poor memory utilization for caching, explain the math that leads to all the observed numbers, and give some tips on parameter tuning to address the problem.
A little bit background first. I’m not working with one of those big names, and do not have thousands of machines at my disposal. My group has less than ten for data crunching. Months of experimental usage of Spark in a standalone configuration showed very promising results, and we want to use those few machines for both production and development. That is, we want to be able to run two instances of Spark apps in parallel. Since we already have Hadoop, Spark on Yarn seems to be a natural choice. It is not difficult at all to setup Spark on Yarn, but I quickly found that I was not able to fire up the second instance of Spark because I was, as seen by Yarn, out of memory. I’ll use the following simplified one-machine setup to demonstrate the problem I’ve seen.
1. Demonstration of the Problem
This demo was run on a desktop with 64g memory. I used the following setting:
yarn.nodemanager.resource.memory-mb = 49152     # 48G
yarn.scheduler.maximum-allocation-mb = 24576    # 24G
SPARK_EXECUTOR_INSTANCES=1
SPARK_EXECUTOR_MEMORY=18G
SPARK_DRIVER_MEMORY=4G
The Yarn parameters went into yarn-site.xml, and the Spark ones in spark-env.sh. I didn’t set any other memory-related parameters.
So the total memory allocated to Yarn was 48G, with 24G maximum for one app. Spark should use 18+4 = 22G memory, which is below the 24G cap. So I should be able to run two Spark apps in parallel.
Following are the numbers I got from all the logs and Web UIs when I actually fired up one Spark app.
- (Yarn) Memory Total: 48G
- (Yarn) Memory Used: 25G
- (Yarn) Container 1, TotalMemoryNeeded: 5120M
- (Yarn) Container 2, TotalMemoryNeeded: 20480M
- (Spark) Driver memory requirement: 4480 MB memory including 384 MB overhead (From output of Spark-Shell)
- (Spark) Driver available memory to App: 2.1G
- (Spark) Executor available memory to App: 9.3G
Below are the relevant screen shots.

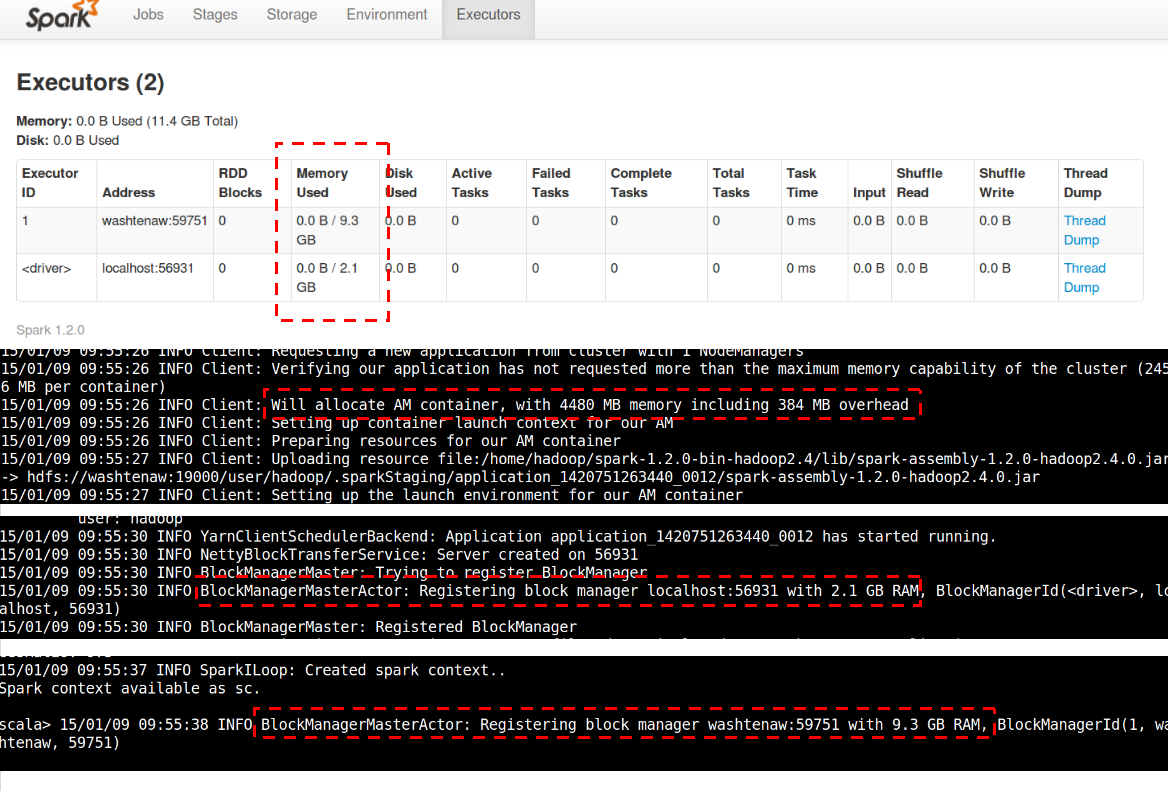
So here are the problems that I see with the driver:
I’ve configured Spark driver to use 4G, and Spark asked Yarn for 4G plus an overhead of 384MB. What reflected in Yarn is that the driver has used 5G. What’s really available in the driver’s block manager is only 2.1G. One has to understand that Spark has to reserve a portion of memory for code execution and cannot give everything to the block manager (the cache), but still,
WHERE HAVE ALL THE MEMORY GONE???
2. The Math Behind
Rule 1. Yarn always rounds up memory requirement to multiples of yarn.scheduler.minimum-allocation-mb, which by default is 1024 or 1GB. That’s why the driver’s requirement of 4G+384M showed up as 5G in Yarn. The parameter yarn.scheduler.minimum-allocation-mb is really “minimum-allocation-unit-mb”. This can be easily verified by setting the parameter to a prime number, such as 97, and see Yarn allocate by multiples of the number.
Rule 2. Spark adds an overhead to SPARK_EXECUTOR_MEMORY/SPARK_DRIVER_MEMORY before asking Yarn for the amount. The rule of overhead is the same for both executor and driver, which is
//yarn/common/src/main/scala/org/apache/spark/deploy/yarn/YarnSparkHadoopUtil.scala
  val MEMORY_OVERHEAD_FACTOR = 0.07
  val MEMORY_OVERHEAD_MIN = 384

//yarn/common/src/main/scala/org/apache/spark/deploy/yarn/YarnAllocator.scala
  protected val memoryOverhead: Int = sparkConf.getInt("spark.yarn.executor.memoryOverhead",
    math.max((MEMORY_OVERHEAD_FACTOR * executorMemory).toInt, MEMORY_OVERHEAD_MIN))
......
      val totalExecutorMemory = executorMemory + memoryOverhead
      numPendingAllocate.addAndGet(missing)
      logInfo(s"Will allocate $missing executor containers, each with $totalExecutorMemory MB " +
        s"memory including $memoryOverhead MB overhead")
This overhead is necessary because when a JVM program is allowed certain amount of memory (by -Xmx), the overall memory usage of JVM could be more than that, and Yarn literally kills programs which uses more memory than allowed (with complicated rules). One can only adjust the two magic numbers by modifying the source.
The above two rules determine how the configured SPARK_XXX_MEMORY finally show up in Yarn.
Rule 3. How much memory does driver/executor see.
One limits the maximal heap memory of JVM by the option “-Xmx”. Part of the specified memory get used by the Scala runtime and other system component, and what a Scala program sees is less then the specified amount. This can be illustrated with the following example.
$ scala -J-Xmx4g
Welcome to Scala version 2.10.3 (OpenJDK 64-Bit Server VM, Java 1.7.0_51).
Type in expressions to have them evaluated.
Type :help for more information.

scala> Runtime.getRuntime.maxMemory
res0: Long = 3817865216
scala>
The runtime eats about 455M. (The above process has an RSS of 140.3M in Linux, so a big portion of the 455M is more like being reserved than actually being used.)
The Spark driver is allocated the configured 4G by JVM options. This can be verified by running the following from inside the Spark shell.
scala>

scala> import java.lang.management.ManagementFactory
import java.lang.management.ManagementFactory

scala> ManagementFactory.getRuntimeMXBean.getInputArguments
res0: java.util.List[String] = [-XX:MaxPermSize=128m, -Djava.library.path=/home/hadoop/hadoop-2.4.1/lib/native, -Xms4G, -Xmx4G]

scala> Runtime.getRuntime.maxMemory
res1: Long = 4116709376

scala>
Rule 4. How Spark determines maximal usable memory
//core/src/main/scala/org/apache/spark/storage/BlockManager.scala
/** Return the total amount of storage memory available. */
private def getMaxMemory(conf: SparkConf): Long = {
  val memoryFraction = conf.getDouble("spark.storage.memoryFraction", 0.6)
  val safetyFraction = conf.getDouble("spark.storage.safetyFraction", 0.9)
  (Runtime.getRuntime.maxMemory * memoryFraction * safetyFraction).toLong
}
We have 4116709376 * 0.6 * 0.9 = 2.07G. That is where the 2.1G value comes from. The maximal available memory of executor is derived in the same way.
Overall, the following two formulas guide memory allocation:
What’s seen by Yarn: (SPECIFIED_MEMORY + OVERHEAD) round up to multiples of minimum-allocation-mb , with OVERHEAD = max(SPECIFIED_MEMORY * 0.07, 384M) What’s usable for cache: (SPECIFIED_MEMORY – MEMORY_USED_BY_RUNTIME) * spark.storage.memoryFraction * spark.storage.safetyFraction
3. Tuning Suggestions
We see that the root of memory under utilization is the over-provisioning done in almost each step. Even if a process really reaches the configured memory cap, it’s unlikely it will keep using that amount of memory all the time. Because Yarn actually kills a process when it exceeds the memory cap, we have to keep SPARK_XXX_MEMORY big enough. It is also very difficult to determine the actual amount of memory gets used by Spark code execution, so dealing with spark.storage.memoryFraction is tricky. But if one is sure that it’s unlikely for the overall memory consumption of parallel Spark apps to exceed the physical memory, the easiest way to improve memory utilization is to counter the over-provisioning with overcommitment. That is, to set the Yarn parameter yarn.nodemanager.resource.memory-mb to MORE THAN THE AVAILABLE PHYSICAL MEMORY (luckily Yarn does not check that). It also helps a little bit to set yarn.scheduler.minimum-allocation-mb to a small value like 100M, so an app does not get much more that what it asks for.